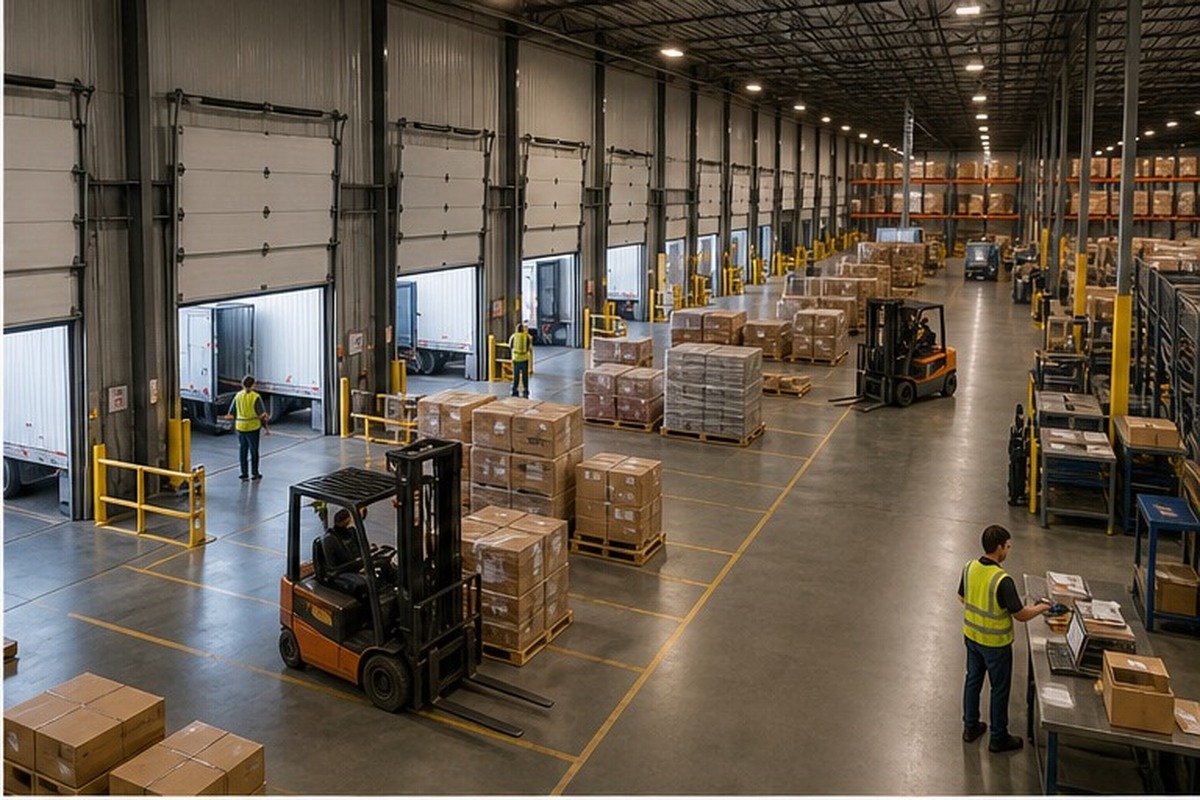
Warehouse operations optimization: Improve flow, labor, and throughput
Sustainable warehouse improvement comes from finding the system constraint, changing the work around it, and measuring the result—not simply asking people to move faster.
Operations optimization treats receiving, storage, picking, staging, and shipping as one connected flow.
Warehouse Upgrade decision model
The constraint-led improvement loop
Improve the system by finding the limiting step, testing one change, and checking the downstream result.
01Baseline
Define units, service outcome, time window, and reliable source data
02Constraint
Locate the step where sustainable capacity or flow is actually limited
03Test
Change work content, travel, slotting, staffing, or release rules in a bounded trial
04Standardize
Confirm throughput, quality, safety, and service before scaling the method
Original Warehouse Upgrade planning diagram. Use verified facility inputs and qualified review where the decision requires it.
Quick answer
What you need to know
Warehouse operations optimization improves receiving, putaway, replenishment, picking, packing, staging, and shipping as one connected system. Establish a reliable baseline, locate the step that limits throughput or service, test a focused change, measure downstream effects, and standardize only after the result is repeatable.
Define the operating outcome
Choose the outcome before selecting a solution: more orders shipped by cutoff, lower cost per line, fewer replenishment interruptions, less dock dwell, shorter travel, or greater peak resilience. A vague efficiency target invites local improvements that may simply move work elsewhere.
Define units, time windows, inclusions, exclusions, and data owners. Units per labor hour, lines per hour, order cycle time, dock turns, and backlog should be calculated consistently across the baseline and test period. The Warehouse Upgrade planning toolkit brings those operating measures together with facility calculators, implementation templates, and specialist resources.
Map flow and locate the constraint
Trace receiving through shipping with volumes, queues, staffing, equipment, travel paths, and system timestamps. The slowest sustainable step—not the most visible complaint—sets the system ceiling. Use the throughput bottleneck method to test the capacity of each stage.
Observe exception work as well as standard work. Short picks, damaged pallets, missing locations, urgent orders, blocked staging, late appointments, and replenishment failures can consume more capacity than the designed process suggests.
Improve travel, slotting, and replenishment together
Travel reduction begins with accurate locations and a slotting policy based on velocity, cube, affinity, ergonomics, and replenishment. Moving fast sellers closer can help, but undersized pick faces may create more replenishment interruptions than the travel saved.
Operating constraints often appear as space problems. Congested receiving, oversized staging, poor slotting, and slow replenishment can make storage look full. Cross-check the space-utilization measures before adding capacity.
Changes to paths, aisles, rack access, equipment, or work methods also require safety review. Record new interaction points, pedestrian routes, guarding, and training needs, then verify that productivity gains do not depend on reduced clearances or unstable workarounds.
Create a trustworthy end-to-end operating baseline
Optimization starts with a common view of how work enters, waits, moves, and leaves the building. Measure the entire flow before selecting technology or setting a department-level target.
Map the process at transaction and floor level
Follow representative inbound and outbound work from release to completion. Record system timestamps, physical handoffs, queues, travel, checks, rework, and exception paths. Compare what the written process says with what actually happens on a normal shift and during peak pressure.
Use a consistent unit such as pallets, cases, order lines, orders, or shipments for each process. Where units differ, preserve the conversion rather than forcing unlike work into one rate. Separate touch time from elapsed time so waiting is visible.
Receiving: arrival, door assignment, unload, check, receipt, and dock-to-stock
Putaway: task release, travel, location search, placement, and confirmation
Replenishment: trigger, queue, reserve retrieval, delivery, and pick-face availability
Picking and packing: release, travel, handling, exception, consolidation, and verification
Shipping: stage, documentation, load, close, and carrier departure
Reconcile system data with direct observation
A timestamp may represent task creation, scan, completion, or later data entry. Validate what each field means and how consistently it is captured. Observe enough examples to find missing moves, shared logins, offline work, batch confirmations, and tasks completed outside the normal process.
Use a short data-quality score beside each KPI. A directional measure with known limitations is safer than a precise dashboard that the floor does not trust. Assign an owner and correction plan for missing or inconsistent data.
End-to-end warehouse baseline by process
Process
Primary outcome
Flow evidence
Balancing measure
Receiving
Accurate inventory available on time
Arrival-to-receipt and dock-to-stock distributions
Receipt accuracy and staging dwell
Putaway
Inventory stored in the right location
Tasks per hour, travel, and search time
Location accuracy and blocked work
Replenishment
Pick faces available before demand
Trigger-to-fill time and stockout minutes
Emergency replenishments and congestion
Picking
Correct lines completed by cutoff
Lines, travel, touches, and exception time
Accuracy, damage, and ergonomic exposure
Packing
Orders verified and ready to ship
Queue, pack time, and rework
Damage, dimensional cost, and accuracy
Shipping
Correct loads depart as committed
Stage-to-load and departure performance
Mispicks, detention, and overtime
Run improvements as controlled operating experiments
A change is valuable only when it improves the targeted outcome without creating a worse queue, quality problem, safety exposure, or cost elsewhere in the system.
Select one constraint and define the test
Choose the process or rule supported by the strongest evidence. Define the hypothesis, affected zone, test period, baseline, expected mechanism, required resources, guardrails, and rollback condition. Keep unrelated changes out of the test window where practical.
Measure the constraint and its immediate upstream and downstream processes. If faster picking simply moves the queue to packing, the local rate improved but system performance did not. The bottleneck guide explains how to detect that transfer.
Primary outcome tied to service, capacity, cost, or flow
Quality, safety, inventory, and employee-impact guardrails
Comparable baseline and test periods
Named decision owner and review date
Standard-work and training changes required if adopted
Stabilize the process before scaling
Confirm that the result holds across shifts, supervisors, order profiles, and peak intervals. Document the new standard, update system rules and visual controls, train affected roles, and retire the old method so two competing processes do not persist.
Continue measuring after rollout. Early gains can fade when slotting changes, new employees arrive, equipment availability drops, or exception work returns. Schedule a follow-up audit and define the condition that triggers another review.
Warehouse Upgrade modeled insight
Modeled labor capacity recovered from travel reduction
80 hr/day
For 50 associates working eight-hour shifts, reducing non-value travel by 12 minutes per labor hour releases 80 modeled labor-hours per day for productive or support work.
Assumptions
50 associates
Eight paid hours per shift
12 minutes recovered per labor hour
Demand is available to use the released time
Calculation
50 × 8 × (12 ÷ 60) = 80 labor-hours per day.
How to use it: This is a capacity model, not a promised headcount reduction. Breaks, indirect work, variability, congestion, and implementation losses must be measured before assigning financial value.
Disclosure: This is an original planning model built from the stated assumptions. It is not an observed industry benchmark, safety finding, or guaranteed result. Replace the assumptions with verified facility data before making a decision.
Drill down
Specific decisions and operating problems
Use these focused guides when the broader framework is already clear and the team needs to resolve one specific comparison, calculation, or failure mode.
A useful capacity plan connects inventory demand with pallet positions, clear height, storage geometry, equipment, flow, and the open space needed to operate.
Rack safety is a management system: know what is installed, control how it is loaded and changed, detect damage early, and keep questionable conditions out of service until qualified review.
A useful warehouse layout turns operating demand into physical zones, adjacencies, travel paths, storage geometry, and controlled space for exceptions and growth.
The automation hardware quote is not the project cost; integration, facility interfaces, exceptions, safety, data, testing, and ownership determine whether the system works.
Frequently asked questions
warehouse operations optimization FAQ
What is warehouse operations optimization?
It is the disciplined improvement of receiving, storage, replenishment, picking, packing, staging, and shipping as one connected system using reliable baselines and verified changes.
Where should a warehouse optimization project start?
Start with a defined service or cost outcome, map the complete flow, validate the data, and identify the constraint that actually limits the system.
Does warehouse optimization require automation?
No. Data accuracy, slotting, travel, replenishment, scheduling, standard work, and layout changes may create value before automation is justified.